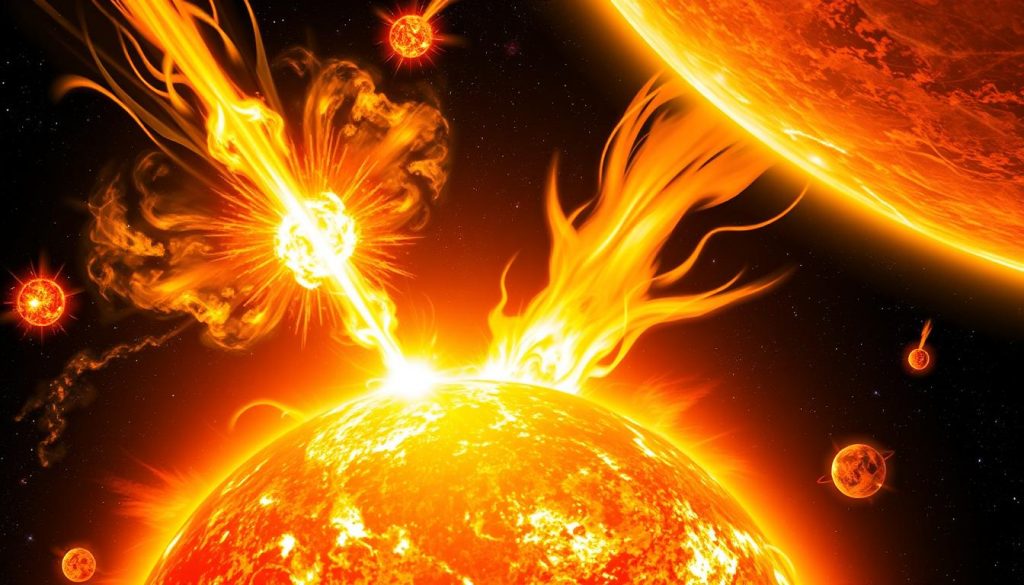
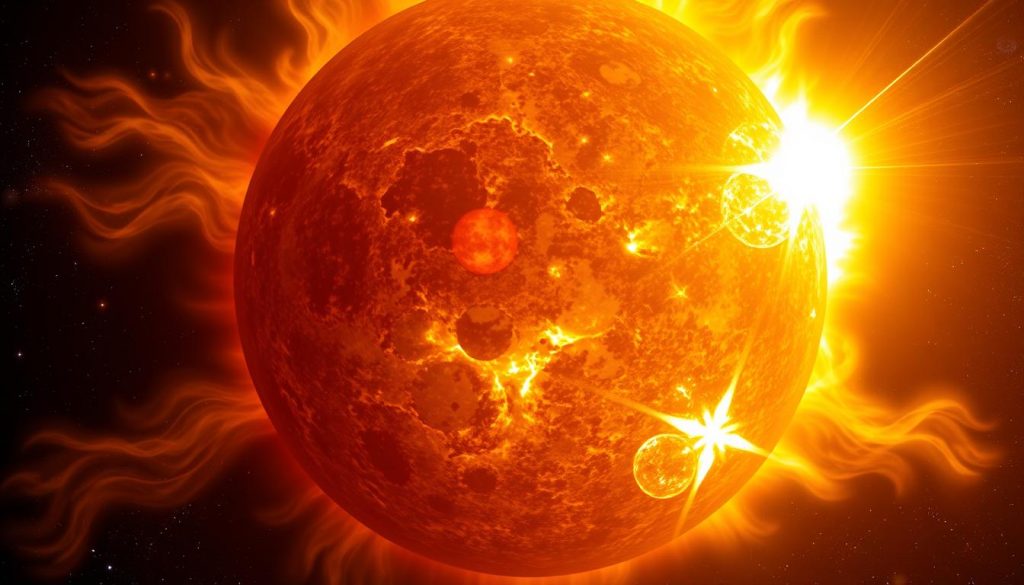
Sunspots and Their Impact on Earth’s Climate
Sunspots are not just beautiful spots on the sun. They are caused by intense magnetic activity. This activity affects the sun’s output, which in turn impacts Earth’s climate.
Anúncios
This article will explore how sunspots, climate, and solar activity are connected. We will look at the solar cycle and its effects on our planet’s temperatures.
It’s important to understand how sunspots affect climate patterns, especially with climate change ongoing. During solar activity peaks, about 0.1% more solar energy reaches Earth.
This can cause temperature increases of 0.05-0.1°C. But, this increase is small compared to other climate factors like volcanic eruptions.
In this section, we will examine historical climate events linked to sunspots. We will also share current scientific insights. This will give you a full picture of their impact.
Understanding Sunspots
Sunspots are fascinating areas on the Sun’s surface with magnetic fields that are much stronger than usual. They are cooler than the surrounding areas and are crucial for understanding the Sun’s behavior. These dark spots can be as big as Earth, spanning from 1,000 to 100,000 miles.
The temperature difference between sunspots and the surrounding photosphere is huge. The photosphere is about 10,000 degrees F (5,538 degrees C). But the umbra, the dark center of a sunspot, is around 6,300 degrees F (3,482 degrees C). This big difference shows how sunspots affect the Sun’s energy.
Sunspots come in pairs with opposite magnetic fields. This is because the Sun’s magnetic field is very turbulent. The magnetic fields in sunspots are about 2,500 times stronger than Earth’s. This strength helps them change the Sun’s energy output during times of high activity.
Learning about sunspot characteristics helps us understand the Sun’s 11-year cycles. These cycles have sunspot numbers that go up and down. Over time, we’ve seen links between sunspot activity and Earth’s climate.
| Characteristic | Details |
|---|---|
| Size | 1,000 to 100,000 miles across |
| Core Temperature | 6,300 degrees F (3,482 degrees C) |
| Photosphere Temperature | 10,000 degrees F (5,538 degrees C) |
| Magnetic Field Strength | 2,500 times stronger than Earth’s |
The Solar Cycle and Its Significance
The solar cycle is a complex dance between the Sun’s magnetic fields and sunspots. It lasts about 11 years. It starts with a solar minimum, where sunspots are few, and ends with a solar maximum, where sunspots are many.
The change in sunspots shows how active the Sun is. This activity affects space weather and our atmosphere. It’s like a big cycle that repeats every 11 years.
Every 11 years, the Sun’s magnetic poles swap places. This change affects the Sun’s activity. Knowing when this happens helps predict big solar events like solar flares and coronal mass ejections.
These events are more common when the Sun is at its most active. The number of sunspots at the solar maximum can vary a lot. Some cycles have more sunspots than others.
Knowing about the solar cycle helps us predict space weather. This is important for keeping radio communications and satellites working. It also keeps astronauts safe, especially during spacewalks.
We are now in Solar Cycle 25, starting in December 2019. It’s expected to be as active as Cycle 24, which peaked at 101 sunspots in 2014. Cycle 25 might see sunspots between 95 and 130, with the most activity between 2023 and 2026.
Looking back, we’ve seen 28 solar cycles in 309 years. Each cycle lasts about 11 years, but they can be shorter or longer. Studying the solar cycle helps us understand the Sun’s impact on space weather and Earth’s climate.
Sunspots and Solar Activity
Sunspots are key indicators of solar activity. They are often linked to solar flares and coronal mass ejections (CMEs). These flares can release energy like millions of hydrogen bombs, affecting Earth’s magnetic field.
When sunspots are active, the Sun produces more solar flares. X-class flares, the strongest, can cause radiation storms. These storms can disrupt satellite communications and affect technology on Earth. CMEs, moving at 1 million to 3 million miles per hour, can also cause geomagnetic storms. These storms can lead to power grid instability and damage equipment.
The link between sunspots and geomagnetic storms is clear during big solar events. The Carrington Event of 1859, the worst geomagnetic storm, damaged telegraph systems. Such storms can also create stunning auroras, visible at lower latitudes during intense activity.
Sunspot activity follows a cycle, changing every 11 years. At solar maximum, up to 200 sunspot groups can appear. This shows why monitoring sunspots is crucial for understanding solar flare and geomagnetic storm risks.

The Maunder Minimum and Climate Effects
The Maunder Minimum is a key part of our study of sunspots and climate. It lasted from about 1645 to 1715. During this time, sunspots were much rarer, with fewer than 50 from 1672 to 1699. This is a big drop from the usual 40,000 to 50,000 sunspots we see today.
During the Maunder Minimum, the Earth saw big changes in the climate, like the Little Ice Age. Europe felt the cold, which changed farming and daily life. Eddy’s research showed a link between less solar activity and cooler Earth temperatures.
The tree-ring 14C record shows more cosmic rays during this time. This matches the low solar activity of the Maunder Minimum. But, it’s important to remember that just because things happen together, it doesn’t mean one caused the other. Scientists are still figuring out how sunspots, climate, and other factors interact.
The Maunder Minimum is the most recent big solar minimum with very few sunspots. It shows how solar cycles might affect the climate over long periods.
The Role of Solar Output in Climate Change
Solar output is key in shaping Earth’s climate. Yet, recent studies reveal that solar output changes over the last 40 years are tiny, less than 0.1 percent. These small changes are overshadowed by the huge warming caused by human-made greenhouse gases, which is over 270 times larger since 1750.
Some research points out that low solar activity, like a grand minimum, might cool Earth by about 0.3 degrees Celsius. However, this cooling wouldn’t undo the long-term warming trend. The warming from greenhouse gases has grown much more than any solar changes. For example, Earth’s solar energy intake has stayed the same since the 1950s, yet global temperatures keep rising.
Historically, big cooling events, like the Maunder Minimum from 1645 to 1715, were linked to fewer sunspots. These events led to the Little Ice Age. But today, solar output’s role in climate change is small. Studies show that human-made greenhouse gases are key to the quick temperature rises we’ve seen lately.
Indeed, models show that greenhouse gases warm the troposphere but cool the stratosphere. Grasping these interactions is crucial for tackling climate change. It helps in creating effective ways to lessen its effects.
Current Solar Cycle Trends
Solar Cycle 25 is showing a big jump in sunspot activity compared to the last cycle. After a low point in December 2019, the cycle is expected to peak in July 2025. It’s likely to be more active than Solar Cycle 24, which was the weakest in a century.
The sunspot number hit 114 in April 2014, falling short of the usual 179. Now, Solar Cycle 25 is expected to reach 115 sunspots. Recent data shows an increase in activity, marking a shift to a more active phase.
It’s important to understand these trends for climate impacts. Researchers are studying how solar events affect Earth’s climate. The team overseeing Solar Cycle 25 has made nearly 50 predictions, showing confidence in the cycle’s direction.

| Characteristic | Solar Cycle 24 | Solar Cycle 25 (Projected) |
|---|---|---|
| Duration | 11 years | Expected to last until 2025 |
| Peak Sunspot Number | 114 | Estimated at 115 |
| Historical Ranking (Intensity) | 4th smallest | Predicted to maintain higher amplitude |
| Activity Variance | Weak variability | Increased activity noted |
| Future Observations | Prior satellite missions | New NOAA spacecraft launch in 2024 |
Keeping an eye on Solar Cycle 25 is key to understanding its impact on our climate. Upcoming missions highlight the need to track solar activity and its effects on Earth.
Scientific Consensus on Sunspots and Climate
The science shows a complex link between sunspots and climate. The Intergovernmental Panel on Climate Change (IPCC) says sunspots’ 11-year cycle affects solar activity. But, their impact on today’s climate is small.
Solar activity might raise the sun’s brightness by 1% during active times. Yet, this change is much less than the big role greenhouse gases play in warming our planet.
Jack Eddy’s 1976 study linked sunspot changes to climate shifts. These small solar changes were later overshadowed by human activities, especially by the 1990s. The IPCC report agrees, saying solar activity can’t explain the warming of the last 50 years.
William Herschel noticed in the 17th century that sunspot lows led to drought and high wheat prices. During sunspot highs, some areas saw cooler sea temperatures, showing short-term climate changes. Early attempts to link African dry spells with sunspots failed, raising doubts about these connections.
The NRC report says solar changes affect local rainfall more than global temperatures. Solar changes play a role in climate, but greenhouse gases are the main cause of today’s climate changes.
| Researcher | Findings |
|---|---|
| Jack Eddy (1976) | Link between sunspot activity and historical climate shifts. |
| William Herschel | Correlation of low sunspots and drought conditions in the 17th century. |
| Charles Greeley Abbot | Minor solar variations might influence climate, but effects overshadowed by greenhouse gases. |
| NRC Report | Solar variability not a cause of recent global warming. |
Observational Evidence and Modern Research
For decades, solar observations have helped us understand sunspots’ impact on climate. Over 40 years of satellite data have given us a deep look into sunspot activity and climate changes. Today, modern climate research sheds light on how solar changes affect global temperatures.
A key discovery is the new way to measure sunspot group size. It shows a power-law distribution, which helps scientists better grasp solar phenomena. This new understanding allows for more accurate analysis of sunspot data:
| Sunspot Group Size Analysis | Previous Studies | New Definitions |
|---|---|---|
| Distribution Range | Approximately four orders of magnitude (1; 10^4) | Increased from 1.5 to 2.5 orders of magnitude |
| Small Groups | Fits a power law | Confirmed with old standards |
| Larger Groups | Suggested Weibull distribution | Now modeled better by log-normal distribution |
| Observation Constraints | Only half of sunspot groups visible from Earth | Many remain undetected due to positioning on the Sun |
| Sunspot Cycle | 11-year cycle observed historically | Numbers wax and wane, impacting visibility |
Since 1874, the Royal Greenwich Observatory has tracked sunspot changes. They’ve seen variations in size and where sunspots appear. This shows how sunspots behave in different latitudes.
Recent studies have updated these findings, making them more accurate. This shows the importance of ongoing research. The data from satellite data and ground-based observations helps us understand solar influence on climate change.
Conclusion
The study of sunspots is key to understanding their effect on Earth’s climate. Their cycles and solar activities link to changes in temperature and weather. Yet, human-made greenhouse gases are the main cause of today’s climate change.
Research should explore solar activity more and link it to climate models. This approach is vital for tackling climate issues. The study of stars like HD 166620, with its unique magnetic behavior, is also important. This is discussed in a research article.
Understanding Earth’s systems requires looking at both cosmic events and human actions. This knowledge helps us grasp the sunspot-climate link. It guides us in adapting to our changing world.
