
How Exoplanet Phase Curves Reveal Hidden Climate Dynamics
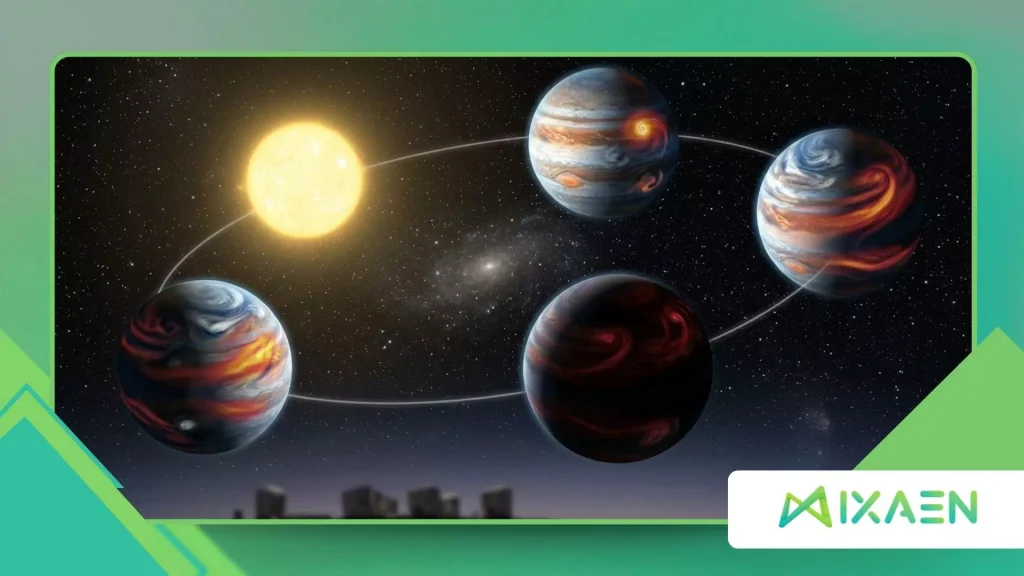
Exoplanet Phase Curves observations provide astronomers with unprecedented windows into the complex atmospheric circulation patterns of distant alien worlds across our galaxy.
Modern space telescopes measure tiny continuous variations in light as a planet orbits its host star, mapping dayside and nightside thermal gradients remotely.
Decoding these subtle light signatures allows researchers to understand wind speeds, cloud distribution, and greenhouse dynamics without ever visiting the system.
Witnessing the birth of planetary meteorology outside our solar system represents a monumental milestone for 2026 astrophysics.
Gathering continuous photometric data across an entire orbital period transforms a simple point of light into a dynamic, shifting meteorological globe.
These curves reveal whether heat is efficiently redistributed around the planet by violent atmospheric jet streams or trapped locally.
Understanding these alien weather engines helps scientists model climate stability on potentially habitable rocky worlds.
Are you ready to explore how starlight variations decode the hidden weather systems of distant exoplanets?
Navigating Exoplanet Meteorology
- Decoding orbital light variations to measure planetary dayside and nightside temperatures.
- Mapping extreme wind transport mechanisms on tidally locked gas giant worlds.
- Utilizing space-based infrared observatories to isolate thermal emission phase signatures.
- Analyzing reflective cloud decks and atmospheric composition through scattering profiles.
What Are Exoplanet Phase Curves and How Do They Work?
Exoplanet Phase Curves record the total combined light of a star and its orbiting planet as the body moves through different orbital angles relative to our viewpoint.
As the planet orbits, we see varying fractions of its illuminated dayside, creating a smooth, repeating sinusoidal modulation in the telescope’s light curve.
When the planet slips behind the star during a secondary eclipse, we measure the isolated starlight, allowing researchers to subtract it and reveal the planetary emission alone.
Think of this process like watching the phases of the Moon, except infrared space telescopes capture the invisible thermal glow of an entire alien globe changing over time.
Recent observational data published by the James Webb Space Telescope team demonstrate how precise infrared photometry maps longitudinal temperature maps on ultra-hot Jupiters.
These light curves show that the hottest point on many exoplanets is shifted eastward from the substellar point due to supersonic equatorial jet streams.
Such massive atmospheric winds act like planetary conveyor belts, moving thermal energy rapidly across hemispheres.
Measuring these subtle light shifts unlocks the fundamental fluid dynamics governing alien atmospheres light-years away from Earth.
How Do Telescopes Separate Starlight From Planetary Signals?
Space observatories measure extremely minute flux variations by staring continuously at a star system for days or weeks without interruption.
Advanced calibration algorithms remove instrumental jitter, stellar spots, and photon noise to isolate the tiny planetary signal.
This rigorous data processing turns raw photon counts into high-fidelity thermal maps of distant worlds.
++ What If We Discover Life That Doesn’t Want to Be Found?
Why Are Hot Jupiters the Prime Targets for Phase Observations?
Tidally locked gas giants orbiting close to their host stars present large day-night temperature contrasts that produce exceptionally strong infrared phase signals.
Their short orbital periods allow astronomers to capture multiple complete cycles within a single observational scheduling window.
These extreme laboratories test our understanding of atmospheric physics under brutal stellar radiation.
Also read: Why Finding Life Elsewhere Might Force Us to Rethink Religion
What Role Do Secondary Eclipses Play in Data Calibration?
Observing the exact moment a planet disappears behind its star provides an instant measurement of the host star’s baseline flux alone.
Subtracting this baseline from the total combined system light leaves astronomers with the pure dayside emission spectrum of the exoplanet.
This calibration step remains essential for accurate climate modeling and temperature calculation.
How Do Phase Curves Reveal Atmospheric Winds and Heat Redistribution?
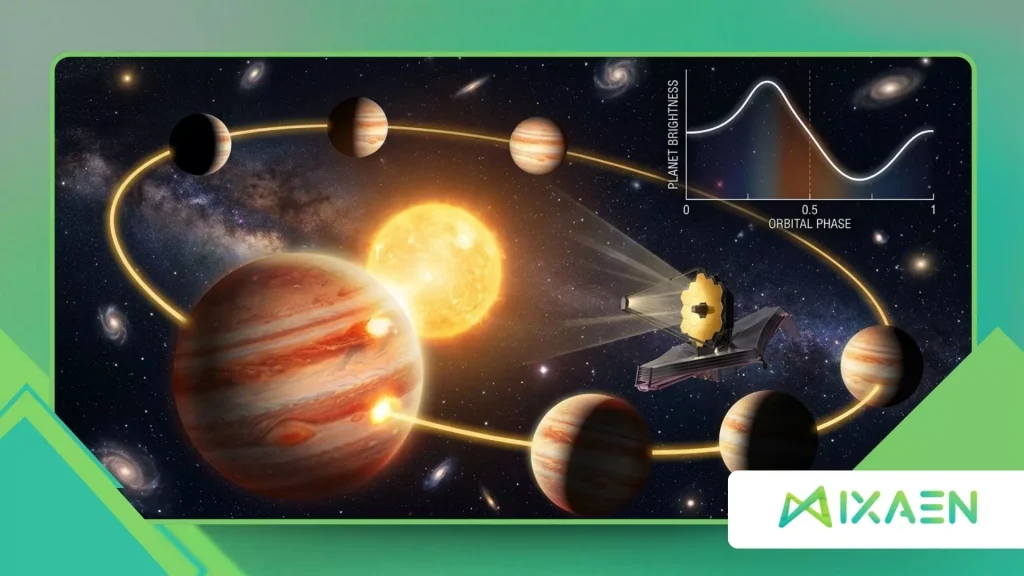
Analyzing Exoplanet Phase Curves lets scientists calculate exactly how efficiently a planet’s atmosphere transports thermal energy from its blistering dayside to its dark nightside.
If a planet possesses high-speed jet streams, the peak of the infrared phase curve shifts significantly away from the direct orbital alignment.
This observable phase shift acts as a direct meteorological fingerprint, quantifying wind speeds that exceed thousands of kilometers per hour.
Without these continuous light curve measurements, determining global wind patterns on unresolvable distant worlds would remain completely impossible.
Consider the analogy of a spinning metal rod heated intensely on one end while a rapid fluid pump circulates coolant through the core.
The temperature distribution along the rod changes depending on how fast the pump moves the liquid through the system.
Similarly, the shape and amplitude of a planetary light curve tell astronomers the exact velocity of global atmospheric heat redistribution.
High-amplitude curves indicate poor heat circulation, whereas flat curves reveal robust, efficient wind transport systems.
Read more: How Exoplanet Water Inventories Influence Climate Stability
How Do Jet Streams Shape Infrared Thermal Peaks?
Supersonic winds push thermal energy eastward before it can radiate directly out into space, creating an asymmetrical light curve peak.
Measuring this spatial offset provides direct empirical proof of global circulation patterns operating light-years away.
Atmospheric physicists use these shifts to refine complex three-dimensional global circulation computer models.
Why Do Nightside Temperatures Vary Between Worlds?
Some ultra-hot planets maintain surprisingly hot nightsides, proving that atmospheric winds transport heat across the terminator line with incredible speed and efficiency.
Other worlds show near-zero nightside emission, indicating that local radiative cooling outpaces horizontal wind transport completely.
These contrasting behaviors highlight the vast diversity of planetary weather systems in the galaxy.
What Does Atmospheric Drag Tell Us About Magnetic Fields?
On highly ionized gas giant worlds, strong stellar winds and planetary magnetic fields create powerful Lorentz forces that act as atmospheric drag brakes.
This magnetic friction slows down equatorial jet streams, altering the expected phase curve shape and thermal offset.
Observing these anomalies allows researchers to probe planetary magnetic fields remotely for the very first time.
Why Are Phase Curves Essential in the Search for Habitable Worlds?
Searching for biosignatures using Exoplanet Phase Curves extends far beyond gas giants, offering critical clues about the atmospheric stability of potentially habitable terrestrial exoplanets.
Rocky worlds orbiting red dwarf stars are often tidally locked, meaning one permanent hemisphere faces blistering starlight while the other freezes in perpetual darkness.
If phase curve observations reveal that a thick atmosphere or deep ocean successfully redistributes heat across the terminator, that world might maintain temperate habitable zones.
Without this atmospheric buffering, volatile chemicals would freeze out on the nightside, collapsing the global climate system entirely.
A landmark comparative study published in Nature Astronomy highlights how future space telescopes will use secondary eclipse phase mapping to detect water vapor and carbon dioxide on terrestrial worlds.
These upcoming observations will determine whether rocky exoplanets possess protective cloud decks that shield surface life from harmful stellar flares.
Understanding climate dynamics through phase variations transforms our methodology from guessing habitability to empirically measuring it.
The universe continues to reveal its atmospheric secrets one photon at a time.
How Do Clouds Influence Terrestrial Phase Variations?
Reflective cloud layers alter the visible light phase curve by scattering incoming stellar radiation back into space before it can be absorbed.
Mapping these reflective variations helps astrobiologists identify active hydrological cycles, weather fronts, and global storm systems on distant rocky planets. Clouds serve as key indicators of dynamic, evolving planetary climates.
What Challenges Face Observations of Small Rocky Planets?
Terrestrial exoplanets produce extremely faint phase signals compared to massive gas giants, pushing current space telescope instrumentation to its absolute physical limits.
Overcoming stellar noise and photon counting limitations requires long integration times and revolutionary coronagraph technologies.
Future observatories scheduled for the next decade aim to resolve these faint rocky signatures routinely.
Why Is Multi-Wavelength Phase Curve Analysis Crucial?
Observing phase variations across multiple infrared and optical wavelengths allows scientists to probe different atmospheric altitude layers simultaneously.
Upper stratospheres absorb different stellar frequencies than lower tropospheres, creating distinct wavelength-dependent phase shifts.
Combining these multi-band datasets builds a comprehensive three-dimensional profile of alien weather systems.
Exoplanet Atmospheric Dynamics Comparison
The structured table below contrasts the atmospheric and observational characteristics of different exoplanet categories analyzed via orbital phase variations.
| Planet Category | Typical Equilibrium Temp | Dominant Weather Driver | Phase Curve Amplitude | Primary Observational Method |
| Ultra-Hot Jupiters | Above 2,000 Kelvin | Dissociation and strong eastward jets | Very High (Large thermal contrast) | Infrared space telescope photometry |
| Warm Neptunes | 600 to 1,200 Kelvin | Moderate cloud decks and zonal winds | Moderate | Multi-wavelength transit and eclipse mapping |
| Habitable Zone Terrestrial | 200 to 350 Kelvin | Ocean circulation and volatile transport | Extremely Low | High-contrast direct imaging and spectroscopy |
Decoding the Climate Future of Distant Worlds
Mastering the analysis of Exoplanet Phase Curves grants humanity an unprecedented observational toolkit to decode the complex meteorological engines operating across the cosmos.
By transforming subtle variations in starlight into detailed global weather maps, astrophysics pushes the boundaries of what we can know about unseen worlds.
Every accurate light curve brings us closer to understanding our own unique place within a galaxy full of diverse planetary climates.
Review your local astronomical society updates today to stay informed on the latest breakthroughs in exoplanet characterization.
How will the discovery of alien weather systems change our philosophical perspective on planetary rarity? Share your thoughts in the comments below!
Frequently Asked Questions
What telescope is primarily used to measure exoplanet phase curves today?
The James Woolsey Space Telescope and specialized orbital observatories lead modern phase curve analysis by providing the extreme infrared photometric precision required to isolate faint planetary signals.
Ground-based Extremely Large Telescopes also contribute increasingly sophisticated high-resolution spectroscopic measurements.
Can phase curves detect weather changes over time on exoplanets?
Yes, repeated long-term monitoring of phase variations can reveal temporal weather changes, shifting storm systems, and variability in cloud cover across multiple orbital cycles.
This capability turns static exoplanet discoveries into dynamic, continuously monitored meteorological laboratories.
Why are tidally locked planets the most common targets for phase curve studies?
Tidally locked planets keep the same hemisphere permanently facing their host star, creating massive day-night temperature differences that produce strong, easily measurable thermal phase variations.
Their short orbital periods also allow astronomers to gather complete datasets much faster than planets on wide, multi-year orbits.
